Fetching Stock Data with AI: A Beginner’s Guide
Introduction
Have you ever wondered how to fetch stock data and analyze it seamlessly? With the rise of artificial intelligence and user-friendly libraries, accessing financial data has never been easier. Whether you’re a curious individual looking to dabble in stock analysis or someone keen on harnessing the power of AI, understanding how to gather and manipulate stock data can help you make informed decisions. In this guide, we’ll walk through fetching stock data using Python, specifically with the help of yfinance, and displaying that data in an interactive AG Grid.
Setting Up Your Environment
Before diving into the code, let’s make sure we have everything we need. First things first, you’ll need to import the necessary libraries:
import reflex as rx
from reflex_ag_grid import ag_grid
import yfinance as yf
from datetime import datetime, timedelta
import pandas as pd
With these libraries installed, you’re equipped to pull stock data, manage dates, and present data in a grid format that’s easy to visualize.
Fetching and Transforming Data
Now, let’s talk about our data-fetching process. The heart of our application is the State class. This is where we define the logic that handles our stock data. Within this class, we have a handy function called fetch_stock_data, responsible for gathering stock information for selected companies.
What Happens When You Click the Button?
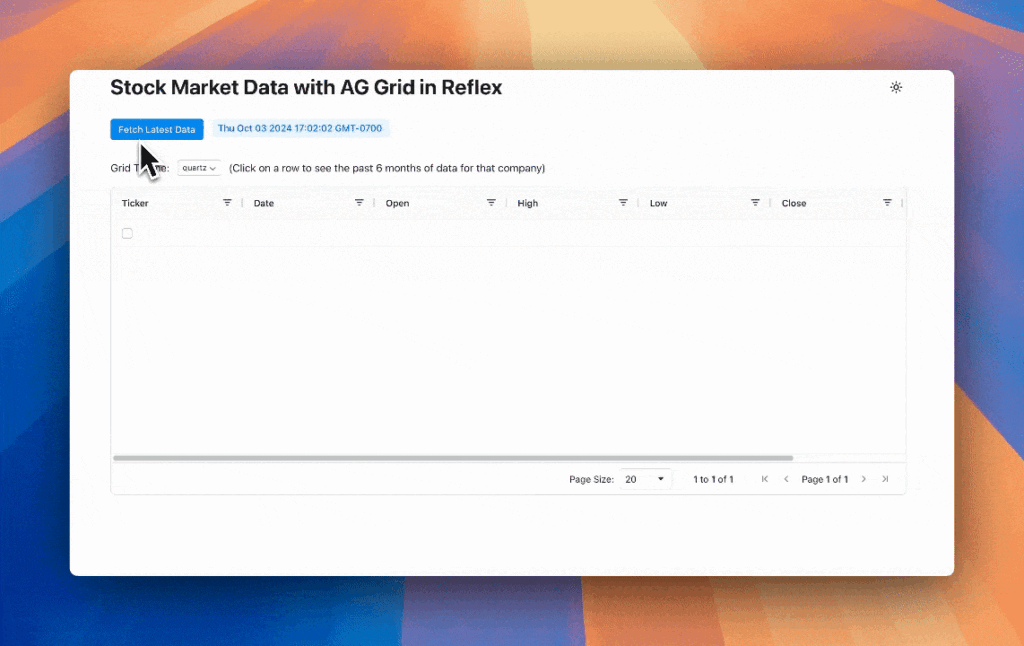
Upon clicking the "Fetch Latest Data" button in the application, this function retrieves stock data for companies like Apple, Microsoft, Google, Amazon, and Meta, pulling data from Yahoo Finance. Here’s how it works:
-
Define Companies: We specify a list of companies we’re interested in:
companies = ["AAPL", "MSFT", "GOOGL", "AMZN", "META"] -
Class State: Within the class, we initialize state variables. These track the fetched data, the processed format for display, and the timestamp of when the data was collected.
-
Fetching Data: The
fetch_stock_datamethod utilizes theyfinancelibrary to download stock data over a previous six-month period. - Transforming Data: The raw data fetched from Yahoo Finance gets polished. This involves rounding off values and creating a structured list of dictionaries, which is perfect for AG Grid format. Additionally, the data is organized by date and ticker symbol to ensure clarity.
self.dict_data = sorted(rows, key=lambda x: (x["date"], x["ticker"]), reverse=True)Why Use the AG Grid?
Displaying data is just as important as fetching it. AG Grid is an exceptional tool, transforming raw data into an interactive table, allowing users to easily access and analyze information. With just a simple click of a button, you’ll have the latest stock performance at your fingertips!
Why This Matters
For many of us, particularly those interested in finance and technology, understanding stock performance is crucial. Whether you’re looking to invest or merely educate yourself, knowing how to retrieve and display data in an efficient manner can lead to better financial decisions.
Conclusion
So there you have it! With just a bit of Python code and some essential libraries, you can fetch and display stock data like a pro. This skill not only boosts your coding abilities but also enhances your understanding of the financial markets.
The AI Buzz Hub team is excited to see where these breakthroughs take us. Want to stay in the loop on all things AI? Subscribe to our newsletter or share this article with your fellow enthusiasts.


