Setting Up an Efficient MLflow Environment for Your AI Experiments
Training and fine-tuning various models is a common undertaking for many computer vision enthusiasts and researchers. Whether you’re working on a simple project or diving into complex datasets, there’s always that question of how to best train your model. From hyper-parameter tuning to data augmentation techniques, choosing an optimizer, learning rate, or deciding the right architecture can feel overwhelming. Should you add more layers? Change the architecture? The questions are endless!
The Old Way: Manual Tracking
In my early days, I struggled with keeping track of my model training processes. I would save logs and checkpoints in different folders on my local machine, changing the output directory name each time I ran a training session. Then, I was left to manually compare metrics one-by-one. This approach? Old school. It consumed a ton of time and energy, and honestly, it was riddled with potential errors.
Enter MLflow: Your New Best Friend
That’s where MLflow comes into the picture. This tool is a game-changer for anyone venturing into machine learning. It allows you to seamlessly track your experiments, logging all the information you might need—from metrics and parameters to model outputs. The best part? You can visualize and compare the results from different training experiments easily, making it straightforward to identify which model is the optimal choice for deployment.
Imagine you’re in a bustling coffee shop in your neighborhood with your laptop open, working on your latest machine-learning project. You can effortlessly log your training sessions with MLflow. No more scattered folders or manual comparisons. Instead, you see all your experiment data in one neat interface, enabling you to make data-driven decisions without breaking a sweat.
A Real-Life Example
Let’s say you’ve been experimenting with different architectures for a face detection model. In the past, you might have jotted down notes and performed comparisons on paper. With MLflow, you can track each model version, its corresponding metrics, and even snapshots of the model itself. This enables not only quick comparisons but also collaborative projects: your teammates can view and analyze the same data and contribute insights that refine the model further.
Getting Started with MLflow
So, how do you dive in? Here’s a quick rundown to get you started with MLflow:
-
Install MLflow: Kick things off by installing MLflow via pip.
pip install mlflow -
Set up the Tracking Server: Launch the tracking server to monitor your experiments. This can be done locally or on a cloud environment.
-
Logging Parameters & Models: Integrate MLflow into your training scripts. Log any hyper-parameters or metrics that you are collecting.
-
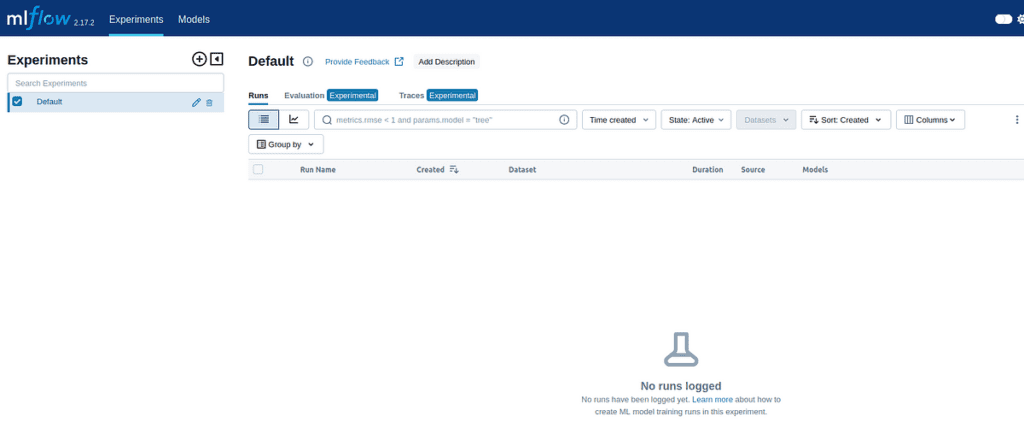
Visualize Results: Access the MLflow UI to view and compare your training results. You can see various metrics in one view, helping you choose the best performing model confidently.
- Deployment: Once the optimal model is identified, you can deploy it seamlessly with MLflow’s model serving capabilities.
Conclusion
Harnessing the power of MLflow not only enhances your ability to track and analyse AI experiments but also brings an organized and friendly interface to what can often become a convoluted process. If you’re looking to improve your model training workflow and gain better insights, MLflow is a trailblazer you should consider integrating into your projects.
The AI Buzz Hub team is excited to see where these breakthroughs take us. Want to stay in the loop on all things AI? Subscribe to our newsletter or share this article with your fellow enthusiasts.


